
Math 141 - Reading Assignments - Fall 2019
| All chapter numbers refer Intro Stats, 4th Edition, by De Veaux, Velleman, and Bock
Be sure to check back often, as assignments may change during the semester |
 Due Thursday 8/29 at 9am
Ch 1: Stats Starts Here
Ch 2: Displaying and Describing Categorical Data
Ch 3: Displaying and Summarizing Quantitative Data
To read:
Skim Chapter 1. Skim the first portion of Chapter 2; focus on Section 2.2. Skim Chapter 3; don't focus on standard deviation, as we'll go into it in detail soon. (I know this is a lot. Please don't be overwhelmed, this is the longest reading assignment of the term)
Reading questions:
- The Registry of Motor Vehicles collects a lot of data related to state residents' vehicles. Which of the following is/are quantitative variables?
- make
- color
- age of the car
- license plate number
- value of the car
- In Tables 2.6, 2.7, and 2.8, consider the cells for Third and Dead. Explain what the values 24.0% in Table 2.6, 35.4% in Table 2.7, and 74.8% in Table 2.8 each represent
- The February 17, 2015 issue of The New York Times included the article At Chipotle, How Many Calories Do People Really Eat?. In it, they present the histogram below, which shows the distribution of calories from a sample of online orders:
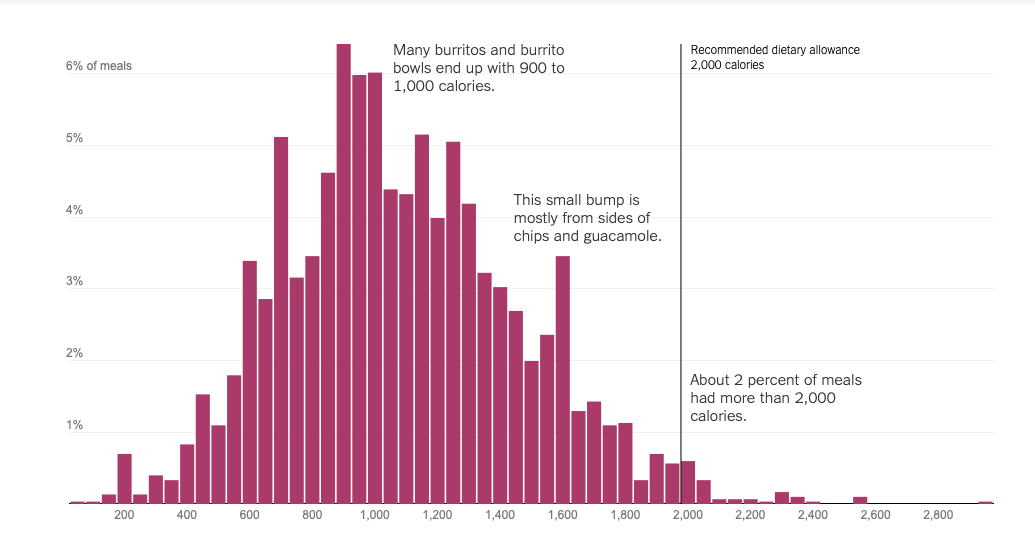
Describe this histogram in a few sentences using the vocabulary of the section (shape, center, spread, unusual features)
Submit answers through OnCourse
Due Thursday 9/5 at 9am
Ch 4: Understanding and Comparing Distributions
To read:
Emphasize Sections 4.1, 4.2, and 4.3; skim the rest of the chapter
Reading questions:
- In Figure 4.1, the authors use both a boxplot and a histogram to display the distribution of the daily average windspeed. In Figure 4.2 when comparing the distribution of average daily windspeeds during the summer to their distribution during the winter, they chose to use only histograms, while in Figure 4.3 when comparing the distribution of the average daily windspeeds for each month, they chose to use only boxplots. Why? Where was the problem?
- What are two things that you should always avoid when dealing with data that has outliers?
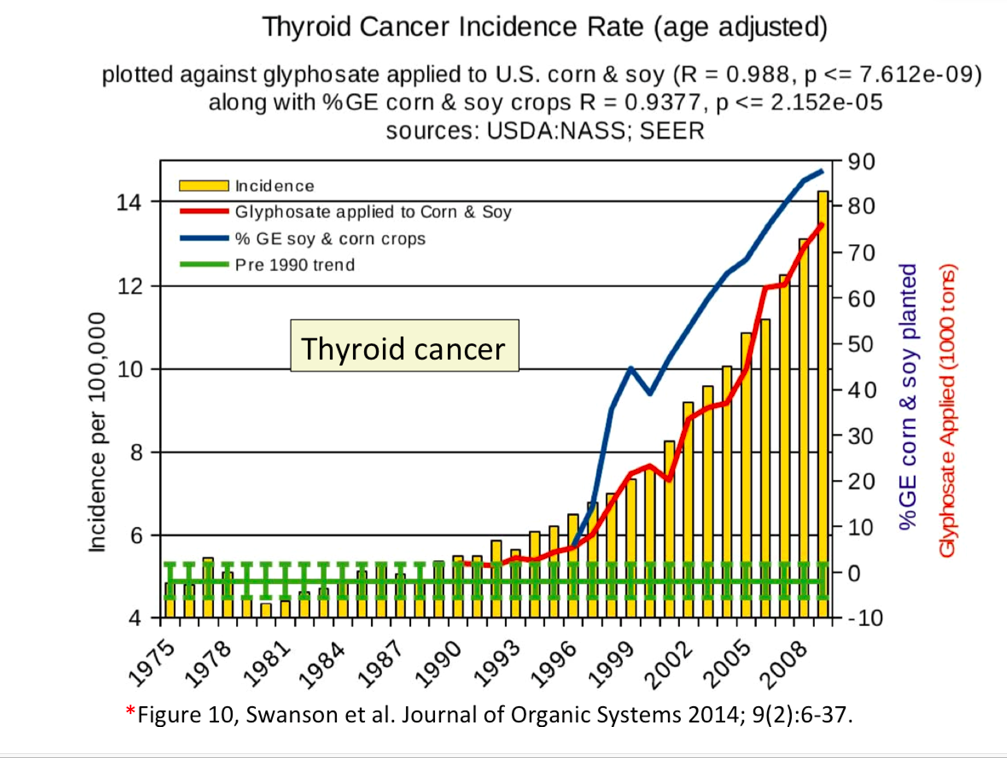
- What is wrong with the following two displays of data? (Don't worry about what the displays are about, just look at how they're displayed):
(a) Source for these graphs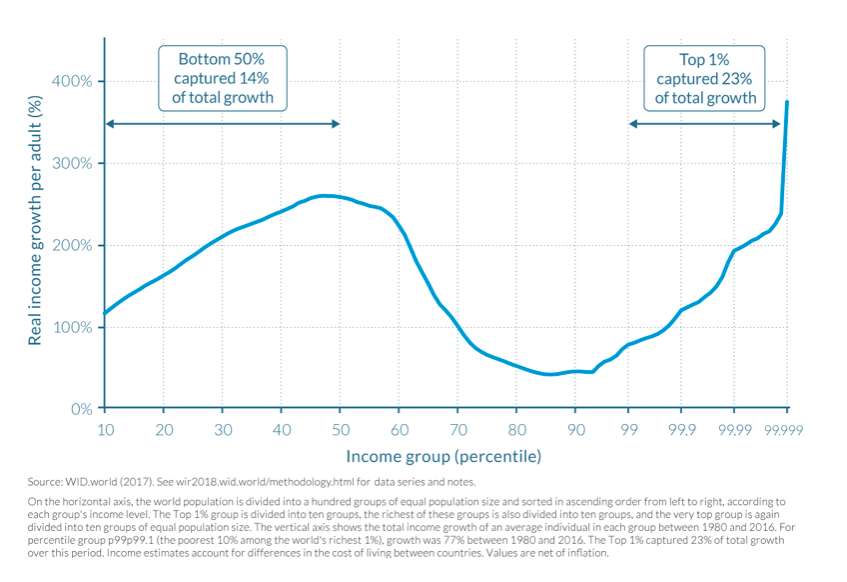
(b)
Submit answers through OnCourse
Due Tuesday 9/10 at 9am
Ch 5: The Standard Deviation as a Ruler and the Normal Model
To read:
Emphasize Sections 5.1 - 5.4; skim Section 5.5
Reading questions:
- Which would be farther from the mean, a data value with a z-score of -2.1 or a data value with a z-score of 1.8?
- What is the difference between a parameter and a statistic?
- When data is Normally distributed, what percentage of the data values lies within 2 standard deviations of the mean?
Submit answers through OnCourse
Due Thursday 9/12 at 9am
Ch 15: Sampling Distribution Models
To read:
All, but you can skip Section 15.3. Be sure to emphasize 15.4
Reading questions:
- What does each data point in a sampling distribution represent?
- In a couple sentences, explain the idea of the Central Limit Theorem, in your own words
- What are the assumptions and conditions necessary for the Normal model to work well as a model of the sampling distribution of a sample proportion? (You do not need to explain these assumptions and conditions; we'll talk about them in class)
Submit answers through OnCourse
Due Tuesday 9/17 at 9am
Ch 15: Sampling Distribution Models
Ch 16: Confidence Intervals for Proportions
To read:
Re-read Sections 15.1, 15.4, and 15.5. Read all of Chapter 16, emphasizing Section 16.2
Reading questions:
- What characteristic of the data determines whether we have a sampling distribution of proportions or a sampling distribution of means?
- In a couple sentences, explain the idea of a confidence interval for a population proportion, in your own words
- Why do we usually talk about 95% confidence intervals, rather than 90% or 99%? That is, what characteristic of the population, or the sampling distribution, makes 95% a particularly convenient number to work with?
Submit answers through OnCourse
Due Thursday 9/19 at 9am
Ch 16: Confidence Intervals for Proportions
To read:
Re-read Chapter 16. Emphasize Section 16.1, work through the Step-By-Step Example near the end of the chapter, and carefully read the What Can Go Wrong section
Reading questions:
- In statement 5 on page 430 at the end of Section 16.1
We are 95% confident that between 23.4% and 38.2% of Facebook users between the ages of 18 and 22 update their status at least daily
explain more precisely what the phrase "we are 95% confident" means - When/where, in calculating a confidence interval for a population proportion p, do we use that the sampling distribution for p̂ is (approximately) Normal?
Submit answers through OnCourse
For Tuesday 9/24
Q & A for Exam 1
- No Reading Assignment due today
- Required: counts toward HW: Fill out the online pre-exam reflection
- Make significant progress through the study guide; bring questions to class
- Look for an article to use for the Stats in the News portion of the exam
For Thursday 9/26
Exam 1
No Reading Assignment due today
Due Tuesday 10/1 at 9am
Ch 17: Testing Hypotheses About Proportions
To read:
All. Pay particular attention to the step-by-step examples that begin on p. 458 and p. 461
Reading questions:
- What is the null hypothesis H0 of a hypothesis test? What is its analog in an American jury trial?
- What is an alternative hypothesis HA of a hypothesis test? What is its analog in an American jury trial?
- What can you decide about H0 from the P-value of a hypothesis test? What are you unable to decide?
Submit answers through OnCourse
Due Thursday 10/3 at 9am
Ch 18: Inferences About Means
To read:
All. Although dressed in new clothes (i.e. new models), the underlying ideas of this chapter are very similar to what we saw in Chapter 16 & 17, but applied to quantitative data and population means rather than to categorical data and population proportions.
Reading questions:
- Why do we need to use the Student's t-models for inferences about means, rather using Normal models as we could when making inferences about proportions? The CLT applies to both types of data, so what is different here?
- What are the two assumptions necessary to use a Student's t-model to model the sampling distribution of the means?
Submit answers through OnCourse
Due Tuesday 10/8 at 9am
Ch 19: More About Tests and Intervals
To read:
Up to the section on Power on page 518
Reading questions:
- Why is α=0.05 often used as the significance level in hypothesis testing?
- Explain the difference between Type I and Type II error
Submit answers through OnCourse
Due Thursday 10/10 at 9am
Ch 20: Comparing Groups
To read:
Through Section 20.5
Reading questions:
- Why do we pool the samples in a two-proportion z-test?
- Why don't we pool the samples in a two-proportion z-interval?
Submit answers through OnCourse
For Tuesday 10/15
Fall Break!
No class meeting, no reading assignment due
Due Thursday 10/17 at 9am
Ch 20: Comparing Groups
To read:
Finish the chapter
Reading questions:
- When is the standard deviation of the difference between two sample means not given by the square root of the sum of the variances?
- Is it ever incorrect to not use pooled t-methods?
Submit answers through OnCourse
Due Tuesday 10/22 at 9am
Ch 21: Paired Samples (and Blocks)
To read:
Through Section 21.3
Reading questions:
- Explain the difference between a paired t-test and a two sample t-test. Come up with an example to explain when you would use one over the other
Submit answers through OnCourse
Due Thursday 10/24 at 9am
Ch 24: Analysis of Variance
To read:
For this first reading, read for the big picture. Pay more attention to Section 24.1, 24.3, and the parts of 24.4 that are not about Bonferroni Multiple Comparisons. Skim Section 24.2, and skip the portion on Bonferroni Multiple Comparisons
Note: This Chapter is posted to OnCourse. It is also included on the CD that comes with new texts.
Reading questions:
- What is the difference between ANOVA and the 2-sample t-tests of Chapter 20?
- What new assumption(s) do we have for using ANOVA, and what conditions do we check to see if we can make that/those assumption(s)?
- Which assumptions do we carry over from previous techniques? Do we do anything different to check them?
Submit answers through OnCourse
Due Tuesday 10/29 at 9am
Ch 24: Analysis of Variance
To read:
Re-read all except for Bonferroni Multiple Comparisons (again skimming Section 24.2). Pay attention to when to use it and how to interpret results
Reading questions:
- Why is ANOVA, a test whose goal is to compare population means, called Analysis of Variance? What role does variance play? (You could very deep here, but I'm looking for the initial intuitive idea)
- For a data set with data points {yi} and mean ȳ, what are the corresponding residuals?
Submit answers through OnCourse
Due Thursday 10/31 at 9am
Ch 6: Scatterplots, Association, and Correlation
Ch 7: Linear Regression
To read:
All, except for Section 6.4 Straightening Scatterplots -- important but we won't be discussing it here
Reading questions:
- What does the correlation coefficient r measure?
- What is the purpose of regression?
Submit answers through OnCourse
For Tuesday 11/5
Q & A for Exam 2
- No Reading Assignment due today
- Make significant progress through the study guide; bring questions to class
- Look for an article with inferential statistics to use for the Stats in the News portion of the exam (see OnCourse or slides from 10/29 for more)
- Remember: HW solutions are available on OnCourse
Due Tuesday 11/12 at 9am
Ch 7: Linear Regression
Ch 8: Regression Wisdom
To read:
Skim back through Chapter 7 to remind yourself of the equation for the regression line, residuals, and the conditions and assumptions for regression. Get a feel for R2. Then read all of Chapter 8. Pay attention to how to be careful with data from multiple groups, the dangers of extrapolation, and of course, when to be wary of confusing correlation and causation
Reading questions:
- What can looking at a graph of the residuals help us see?
- What are two ways that a data point can be influential?
Submit answers through OnCourse
Due Thursday 11/14 at 9am
Ch 23: Inferences for Regression
To read:
All. Pay particular attention to the examples beginning on pages 650 and 657
Reading questions:
- What is the difference between the fitted line ŷ=b0+b1x and the idealized regression line μ=β0+β_1 x?
- In regression analysis, why is the null hypothesis always that slope β_1=0?
Submit answers through OnCourse
Due Tuesday 11/19 at 9am
Ch 23: Inferences for Regression
To read:
Re-read all; pay particular attention to the discussions of confidence intervals. You can just skim through the section on Logistic Regression.
Reading questions:
- What are the two types of confidence intervals in regression inference?
- What is the distinction between these two kinds of confidence intervals?
Submit answers through OnCourse
Due Thursday 11/21 at 9am
Ch 25: Multiple Regression
To read:
Read through Section 25.4. Pay particular attention to the extended example that begins with "Another Example: Modeling Infant Mortality" that begins on page 753 and extends through the step-by-step example.
Note: Like Chapter 24, this chapter is posted to OnCourse, as well as being available on the CD that comes with new texts
Reading questions:
- How does multiple regression differ from the linear regression models that we discussed in Chapter 7 and 8?
- What is the advantage of multiple regression over the simple regression models from Chapters 7 and 8?
- What is the most common error made with multiple regression?
Submit answers through OnCourse
Due Tuesday 11/26 at 9am
Ch 22: Comparing Counts
To read:
All
Reading questions:
- What does the chi-square (χ2) statistic measure? Explain the idea in your own words in a couple of sentences.
- If the P-value associated with a value of χ2 leads you to reject the null hypothesis, does that mean that there is a cause-and-effect relationship between the two variables, or that one depends on the other?
Submit answers through OnCourse
Janice Sklensky
Wheaton College
Department of Mathematics and Computer Science
SC 1306
Norton, Massachusetts 02766-0930
TEL (508) 286-3973
FAX (508) 285-8278
sklensky_janice@wheatoncollege.edu
Back to: Intro Statistics | My Homepage | Mathematics Department